
THE BASICS OF DESCRIPTIVE STATISTICS
The Basics of Descriptive Statistics
Descriptive statistics is a branch of statistics that involves organizing, summarizing, and presenting data in a meaningful way. It provides a clear and concise understanding of the main characteristics of a dataset, making it an essential tool for researchers, analysts, and decision-makers. In this article, we’ll explore the fundamental concepts and techniques of descriptive statistics.
Introduction to Descriptive Statistics
Descriptive statistics is primarily concerned with:
- Data Description: It involves summarizing raw data through various measures, such as averages, ranges, and percentages.
- Data Visualization: Representing data graphically, which can make patterns and trends more evident.
Measures of Central Tendency
Measures of central tendency provide insight into the “center” or typical value of a dataset. Common measures include:
- Mean: The arithmetic average of all data points.
- Median: The middle value in a dataset when arranged in ascending order.
- Mode: The most frequently occurring value.
These measures help in understanding where the majority of data points cluster.
Measures of Dispersion
Measures of dispersion describe the spread or variability in a dataset. Key measures include:
- Range: The difference between the maximum and minimum values.
- Variance: A measure of how individual data points differ from the mean.
- Standard Deviation: The square root of the variance, indicating the average deviation from the mean.
These measures help assess the consistency and distribution of data.
Data Distribution
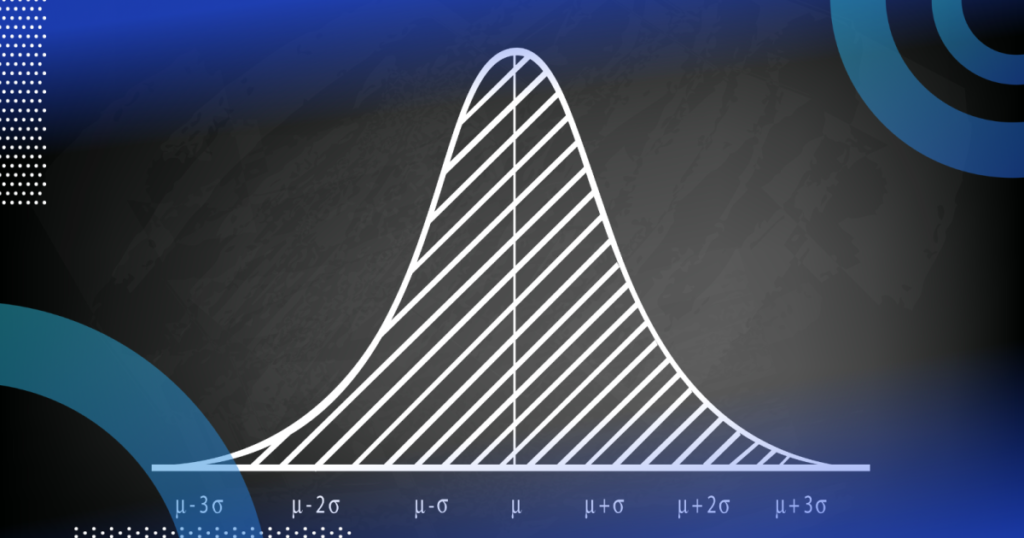
Understanding the distribution of data is vital. Distributions can be:
- Normal Distribution: Data is symmetrically distributed around the mean.
- Skewed Distribution: Data is asymmetrically distributed, leaning towards one side.
- Bimodal Distribution: Two distinct peaks in the data.
Recognizing the distribution is crucial for making statistical inferences.
Data Visualization
Visual representation of data includes:
- Histograms: Displays the frequency distribution of a dataset.
- Box Plots: Summarizes the minimum, 1st quartile, median, 3rd quartile, and maximum values.
- Scatter Plots: Shows the relationship between two variables.
Effective visualization can reveal patterns, outliers, and associations in data.
Percentiles
Percentiles divide a dataset into 100 equal parts, indicating how a specific value compares to others. The 50th percentile is the median. Percentiles are useful for comparing individual data points to the rest of the data.
Skewness and Kurtosis
Skewness measures the asymmetry of data, while kurtosis measures the “tailedness.” Both statistics provide insights into the shape of the distribution.
Practical Applications
Descriptive statistics is indispensable in various fields:
- Business: Analyzing sales data, customer feedback, and financial reports.
- Medicine: Studying patient outcomes, clinical trials, and disease prevalence.
- Social Sciences: Understanding survey responses and public opinion.
- Education: Assessing student performance and exam scores.
Descriptive statistics is the foundation of data analysis. It provides a sn apshot of a dataset’s key characteristics, aiding in decision-making and drawing meaningful insights. Whether you’re analyzing financial data or conducting research, a solid grasp of descriptive statistics is essential for making informed conclusions and predictions.